FITI GROUP
Sustainability

Environmental Sustainability

GHG Inventory

To align with the global net-zero transition and gain a comprehensive understanding of FITI’s carbon emissions, FITI initiated the establishment of a global greenhouse gas (GHG) inventory system in 2017. We adopted the ISO 14064-1 international standard and obtained third-party verification to ensure information transparency and credibility. Through continuous enhancement of the system over the years, a robust GHG accounting mechanism has now been established, covering our major global operating sites.

2024 GHG Emissions Source Analysis (Kezhong Site, Keyan site, UC Site)

Total Emissions In Comparison – Kezhong, Keyan, the US Office (2023 vs 2024)

In 2024, the total GHG emissions for Kezhong, Keyan, and the US Office decreased by approximately 2,723.4303 metric tons of CO2e, representing a 13.93% reduction compared to 2023.

2024:16,832.7154 tCO2e
2023:19,556.1457 tCO2e

The primary driver of the overall emissions reduction was the significant decrease in Category 3.1. Specifically, the emissions dropped from approximately 7,092 metric tons of CO2e in 2023 to 3,587 metric tons of CO2e in 2024. Category 3.1 refers to transportation-related emissions from the company’s direct imports of raw materials.


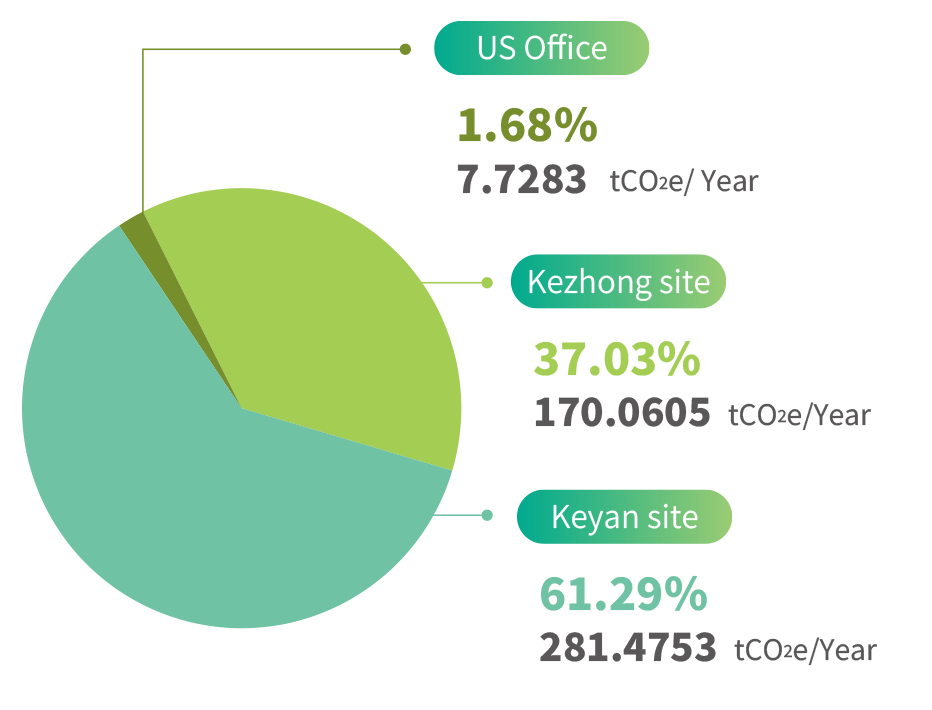
Proportion of Direct GHG Emissions – Kezhong, Keyan, US Office (Category 1)

In 2024, the total direct (Category 1) GHG emissions from Kezhong (including dormitory), Keyan, and the US Office amounted to 459.2641 metric tons of CO2e, accounting for 2.73% of the total emissions.

Category 2 Greenhouse Gas Emissions Proportion by Site: Kezhong, Keyan, Songjiang, Kunshan, and U.S. Office in 2024

In 2024, the energy indirect GHG emissions (Category 2) from Kezhong (including dormitories), Keyan, and the U.S. Office amounted to 6,423.3807 metric tons of CO2e, accounting for 38.15% of the Group’s total emissions. The main source of indirect emissions is purchased electricity. Both Kezhong and Keyan procure electricity from Taiwan Power Company, while the U.S. Office purchases electricity from Pacific Gas and Electric Company (PG&E).
This version of the Sustainability Report is issued in August 2025. As the Songjiang and Kunshan sites are scheduled to complete third-party verification of their GHG inventories under ISO 14064 in Q4 2025, relevant data will be disclosed in next year’s Sustainability Report.
As shown in the table on the right, Category 2 (Scope 2) emissions from two China sites (Songjiang + Kunshan) account for 71.82%, while Category 2 emissions from Taiwan sites and the U.S. Office account for only 28.18%. This indicates that the majority of the Group’s electricity-related carbon emissions are concentrated in its China-based facilities.

2023 vs 2024 各廠區用電排放比較

From 2023 to 2024, Category 2 emissions increased by approximately 15.65%, equivalent to an increase of 3,084.72 metric tons of CO2e.

2024:22,794.36704 tCO2e
2023:19,709.6434 tCO2e

Among all sites, only the Kezhong site showed a slight decrease in emissions, while all other facility sites experienced an upward trend in both electricity consumption and emissions. The primary reason for the increase is the overall growth in electricity usage and production output across the sites in 2024. The data indicate a positive correlation between electricity consumption and production volume.

Kezhong site

↓ 342.932 tCO2e

2024:2,663.6710 tCO2e
2023:3,006.6030 tCO2e

Keyan site

↑ 906.64 tCO2e

2024:3,754.6488 tCO2e
2023:2,848.0088 tCO2e

US Office

↑ 0.5228 tCO2e

2024:5.0609 tCO2e
2023:4.5381 tCO2e

Songjiang site

↑ 1,140.5043 tCO2e

2024:5,149.2168 tCO2e
2023:4,008.7125 tCO2e

Kunshan site

↑ 1,379.9912 tCO2e

2024:11,221.7695 tCO2e
2023:9,841.7783 tCO2e

Category 3: Upstream Transportation

↓ 49.42%

2024:3,586.9991 tCO2e
2023:7,091.8106 tCO2e

Category 5: Downstream Leased Assets

↓ 11.18%

2024:3,862.6407 tCO2e
2023:4,349.0549 tCO2e

Category 4: Upstream Emissions from Purchased Goods

↑ 13.87%

2024:1350.4197 tCO2e
2023:1,185.9233 tCO2e

Note1:Since 2017, Our annual GHG inventory reports have been verified by an independent third party. Data for the previous year are disclosed each June.

Note2:Unit: metric tons of CO₂ equivalent (tCO2e)

Geographical Boundary: Kezhong site (including FITI, FATI, and Kainova)

Year│Annual Verification Statement Emission Categories Total GHG Emissions
Category1 Category2 Category3-6
The Year 2024│ 170.0605 2,663.6710 9,085.4633 11,919.195
The Year 2023│ 173.4523 3,006.6030 12,630.9569 15,811.012
The Year 2022│ 151.6125 3,100.7145 7,866.4107 11,118.738
The Year 2021│ 143.8901 2,966.4932 9,033.8270 12,144.210
The Year 2020│ 113.1315 2,675.3529 9,663.2447 12,451.729
The Year 2019│ 112.1523 2,491.2229 -- 2,603.375
The Year 2018│ 96.6225 2,623.0657 -- 2,179.688
The Year 2017│ 97.9855 2,371.9122 -- 2,469.898

Geographical Boundary: Keyan Site (including FITI and FATI)

Year Emission Categories Total GHG Emissions
Category1 Category2 Category3-6
The Year 2024 281.4753 3,754.6488 860.8279 4,896.952
The Year 2023 282.1141 2,848.0088 591.6313 3,721.754

Geographical Boundary: Foxsemicon LLC (US Office)

Year Emission Categories Total GHG Emissions
Category1 Category2 Category3-6
The Year 2024 7.7283 5.0609 3.7794 16.569
The Year 2023 13.7617 4.5381 5.0795 23.379
The Year 2022 4.7543 10.4196 - 15.174
FIGS and Kaivaco only have registered addresses and no actual business operations at the registered addresses. The subsidiaries of Foxsemicon Integrated Technology Inc. (SAMOA), including the operating Success Praise Corporation and Mindtech Corporation, as well as the discontinued Smart Advance Corporation, Loyal News International Limited, and Ever Dynamic Corporation, are only registered in Samoa with no actual operating offices or factories. None of the above produced greenhouse gas emissions.